Difference between horizontal and vertical analysis
What are the differences between vertical and horizontal analysis? Which method would external users most likely use? Discuss the uses of the two analysis methods and how you would use each to analyze a company’s performance?
Vertical analysis reports each amount on a financial statement as a percentage of a base item. For example, the vertical analysis of the balance sheet means every amount on the balance sheet is restated to be a percentage of total assets. For the income statement, we have the base item as sales.
A vertical analysis is used to show the relative sizes of the different accounts on a financial statement. For example, when a vertical analysis is done on an income statement, it will show the top-line sales number as 100%, and every other account will show as a percentage of the total sales number.
Order custom essay Difference between horizontal and vertical analysis with free plagiarism report
 450+ experts on 30 subjects
 Starting from 3 hours delivery
The restated financial statement is known as common size financial statement. A common-size income statement allows you to compare your company’s income statement to another company’s or to the industry average.
How do you calculate the vertical analysis?
- Vertical Analysis Formula (Income Statement) = Income Statement Item / Total Sales * 100.
- Vertical Analysis Formula (Balance Sheet) = Balance Sheet Item / Total Assets (Liabilities) * 100.
Horizontal analysis looks at amounts on the financial statements over the past years. For example, the amount of cash reported on the balance sheet at December 31 of 2006, 2005, 2004, 2003, and 2002 will be expressed as a percentage of the December 31, 2002 amount. Instead of dollar amounts you might see 134, 125, 110, 103, and 100. This shows that the amount of cash at the end of 2006 is 134% of the amount it was at the end of 2002. The same analysis will be done for the other items. It is also known as Trend Analysis.
Horizontal analysis (also known as trend analysis) is a financial statement analysis technique that shows changes in the amounts of corresponding financial statement items over a period of time. It is a useful tool to evaluate the trend situations. The statements for two or more periods are used in horizontal analysis.
What is an example of horizontal analysis?
Horizontal analysis compares account balances and ratios over different time periods. For example, you compare a company's sales in 2014 to its sales in 2015. The following figure is an example of how to prepare a horizontal analysis for two years.
Horizontal analysis and vertical analysis examples:
External users will most likely use Horizontal Analysis. The external users will be interested to know the trend and determine the growth pattern of the business.
Internal users will use more of Vertical Analysis. They will want to control their expenses in the income statement and will use expenses as the percentage of sales.
Also, they will need to compare their performance in terms of relative expenses (as a percentage of sales) with other companies.
Horizontal analysis will be used for analysis the growth pattern of the business over a number of years.
Vertical analysis will be needed for performance comparison with other companies and the industry.
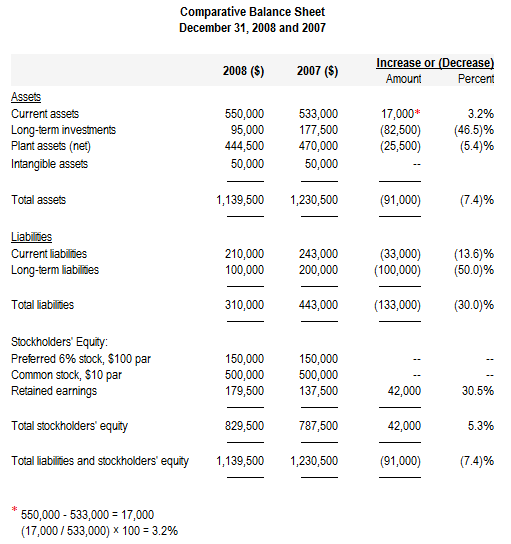
Comparative balance sheet with horizontal analysis:
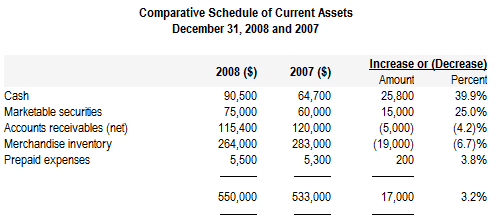
Comparative schedule of current assets:
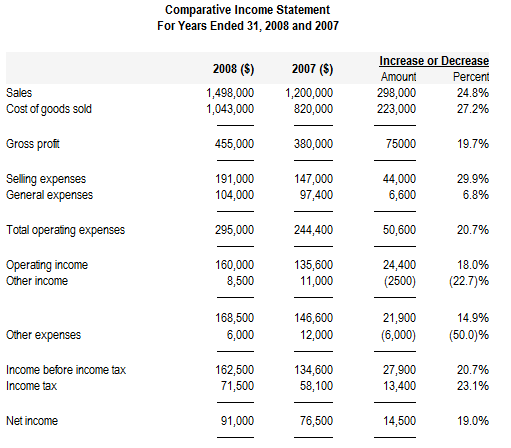
Comparative income statement with horizontal analysis:
Comparative retained earnings statement with horizontal analysis:

What three ratios would you list as the most important? Why? Which ratios would external users be most interested in? Why? Which ratios would best help internal users manage the business? Why? Beyond the basic financial statements what other information would you want to fully analyze a company’s performance? Why?
- Return on Investment ratio= Net Profit before Tax / Net Worth
This ratio tells the owner whether or not all the effort put into the business has been worthwhile. If the ROI is less than the rate of return on an alternative, risk-free investment such as a bank savings account, the owner may be wiser to sell the company, put the money in such a savings instrument, and avoid the daily struggles of small business management.
- Net Profit Margin Ratio = Net Profit Before Tax / Net Sales
It provides a good opportunity to compare your company's "return on sales" with the performance of other companies in your industry.
- Current Ratio = Total Current Assets / Total Current Liabilities
A general acceptable ratio is 2:1. It determines whether the business has enough current assets to pay for the current debts and have a margin to pay for the losses in current assets.
External users will be most interested in return on investment ratio to determine whether it would be fruitful if they invest in the company.
What is the difference between vertical and horizontal analysis
A horizontal analysis typically looks at a number of years. By contrast, a vertical analysis looks only at one year. Horizontal analysis compares financial information for one company with the same types of financial income for the same company in one or more previous years.
Also, external users will be interested in debt service coverage ratio. It is calculated as Net Operating Income/Total Debt Service. Basically, they will be keen to know if the business has enough income to meet the annual interest and principal payments.
Internal users will be most interested in Net profit margin ratio. They would want to know if the sales are generating enough returns. Also, the other ratio is current ratio. It ensures the continuity of the business when the current liabilities will be adequately met by the current assets. Also, you can read which event most likely explains renewed demand in a recovery period?
The company’s present stock price and its trend will help in analyzing a company’s performance. Other information giving insights of the company’s performance if the customer satisfaction, internal operations (efficiency, speed, etc.) and human resource management like employee satisfaction are leading indicators of company’s performance.
The notion behind the extraordinary-items accounting treatment is to prevent "once-in-a-lifetime" events from skewing a company's regular earnings. Most analysts and investors add extraordinary items back to the company's reported net income to get a sense of what the company's "real" profitability was.
Under US GAAP, extraordinary items are permitted but restricted to infrequent, unusual and rare items that affect profit and loss. However, it is prohibited under IAS.
Thus, extraordinary items give companies somewhat of a "hall pass" with the markets, allowing them to sometimes report lower earnings but get credit for higher earnings. Obviously, it is tempting for companies to try to report every bad thing that happens as an extraordinary item.
The average investor may not understand the difference. He may be tempted to think that the company is performing well but due to some bad event, it has suffered. In some cases, this may not be the case and the investor can be cheated.
This is why Accounting Principles Board Opinion No. 30 largely governs the accounting treatment and qualifications of extraordinary items.
Related Questions
on Difference between horizontal and vertical analysis
Cite this Page
Difference between horizontal and vertical analysis. (2018, Jan 25). Retrieved from https://phdessay.com/vertical-and-horizontal-analysis/
Run a free check or have your essay done for you
